Here at South Warwickshire University NHS Foundation Trust (SWFT), we believe that everyone has the right to good and equitable healthcare access, experience and outcomes. However, we know that due to the complex interaction of social, environmental and economic factors (such as who you are, where you live, your job and lifestyle) this is not always the case.
What are health inequalities
Health inequalities are unjust and avoidable differences in people’s health across the population and between specific groups. The conditions in which we are born, grow, live, work and age can impact our health and wellbeing. These are sometimes referred to as wider determinants of health. Wider determinants of health are often interlinked. For example, someone who is unemployed may be more likely to live in poorer quality housing with less access to green space and less access to fresh, healthy food.
This means some groups and communities are more likely to experience poorer health than the general population. These groups are also more likely to experience challenges in accessing healthcare.
The reasons for this are complex and may include:
- the availability of services in their local area
- service opening times
- access to transport
- access to childcare
- language (spoken and written)
- literacy
- poor experiences in the past
- misinformation
- fear
Data demonstrates stark inequalities for those from more deprived groups, from ethnic minorities, and for those with severe mental illness or learning disabilities, among others (such as people experiencing homelessness).
The need and desire to tackle health inequalities rose up the agenda in the wake of the Covid-19 pandemic as inequalities in health outcomes were laid bare. At national, regional and local levels there is concurrent and collaborative action taking place to reduce health inequalities.
Tackling health inequalities
The Kings Fund Model (Figure 1) takes a wide and holistic view of health, breaking population health into four quadrants to describe what the population needs to be in good health. Inequalities are also driven by the ways in which health services are designed, delivered, funded, and by the quality of clinical care received.
Figure 1: Kings Fund model of population health
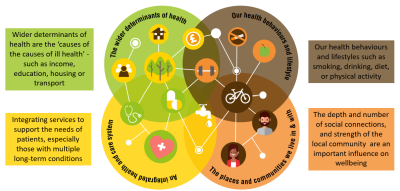
The NHS plays a role in both mitigating against the impact of the wider determinants and in reducing healthcare-based inequalities. Addressing health inequalities will improve the quality of clinical care, patient outcomes and safety.
Tackling health inequalities is a local strategic priority of Warwickshire’s Health and Wellbeing Board, of which SWFT is a member. The Warwickshire Joint Local Health and Wellbeing Strategy sets out a priority for partners to tackle and reduce health inequalities
Core20PLUS5 – reducing health inequalities
Across the Coventry & Warwickshire ICS, the Health Inequalities Strategic Plan (2022 – 2027) sets out a five year plan on how the system intends to reduce health inequalities, using the NHS ‘Core 20 Plus 5’ model (Figure 2). This model sets out which groups are most at risk of experiencing health inequalities, and the clinical areas in which the NHS will focus its efforts to reduce inequalities.
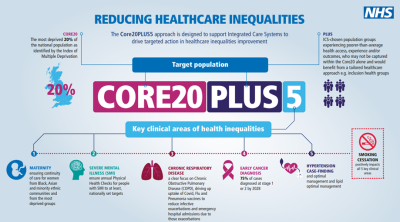
In addition to the CORE20PLUS5 model, NHSE identifies 5 priority areas:
- Restoring NHS services inclusively
- Mitigating against digital exclusion
- Ensuring datasets are complete and timely
- Accelerate preventative programmes
- Strengthen leadership and accountability
Our work to reduce health inequalities
At SWFT we recognise our crucial role to reducing health inequalities and believe that reducing health inequalities is the business of everyone in the organisation.
Therefore, across The Trust we are engaging in various initiatives linked to identifying and addressing health inequalities. Below are a few examples of this work.
Data
We are ensuring that key reports and datasets contain the correct and complete relevant demographic data that are used to generate reports and dashboards for monitoring health inequalities. This includes information around a person’s gender, age, ethnicity, deprivation details.
Table 1 below is an example of how SWFT breakdown hospital admissions and activity by demographic data.
Table 1. SWFT Emergency and Elective admissions and outpatient activity
|
Population Group |
Non elective/ Emergency Admissions |
Elective Admissions |
Outpatient Activity |
|
||||
|
2019/20 |
2024/25 |
2019/20 |
2024/25 |
2019/20 |
2024/25 |
|
||
|
|
|
|
|
|
370579 |
393765 |
|
|
|
Total no.
|
24,700
|
36, 913
|
37, 365
|
43, 256
|
|
|||
|
Age |
|
|||||||
|
% Patients under 18 years |
15.68% |
14.08% |
2.71% |
3.35% |
9.70% |
8.47% |
|
|
|
% Patients over 18 years |
84.32% |
85.92% |
97.29% |
96.65% |
90.30% |
91.53% |
||
|
Gender |
||||||||
|
% female |
52.94% |
55.96% |
54.80% |
53.81% |
56.15% |
56.76% |
||
|
% male |
47.06% |
44.04% |
45.20% |
46.19% |
43.85% |
43.24% |
||
|
Ethnicity |
||||||||
|
British |
82.65% |
77.08% |
82.16% |
78.88% |
77.12% |
73.47% |
||
|
Irish |
0.88% |
0.65% |
0.85% |
0.70% |
0.74% |
0.61% |
||
|
Any other white background |
6.18% |
5.68% |
5.07% |
5.25% |
5.30% |
5.54%
|
||
|
White and black Caribbean |
0.24% |
0.25% |
0.13% |
0.22% |
0.20% |
0.24% |
||
|
White and black African |
0.11% |
0.08% |
0.10% |
0.04% |
0.08% |
0.07% |
||
|
White and Asian |
0.31% |
0.31% |
0.22% |
0.28% |
0.30% |
0.31% |
||
|
Any other mixed background |
0.40% |
0.47% |
0.22% |
0.25% |
0.33% |
0.43% |
||
|
Indian |
2.60% |
3.03% |
2.19% |
2.36% |
2.94% |
2.79% |
||
|
Pakistani |
0.36% |
0.32% |
0.23% |
0.30% |
0.34% |
0.36% |
||
|
Bangladeshi |
0.04% |
0.07% |
0.03% |
0.03% |
0.07% |
0.08% |
||
|
Any other Asian background |
0.81% |
1.38% |
0.66% |
0.97% |
0.73% |
1.00% |
||
|
Caribbean |
0.17% |
0.20% |
0.16% |
0.22% |
0.21% |
0.23% |
||
|
African |
0.16% |
0.31% |
0.16% |
0.19% |
0.24% |
0.30% |
||
|
Any other black background |
0.07% |
0.30% |
0.06% |
0.14% |
0.10% |
0.20% |
||
|
Chinese |
0.18% |
0.34% |
0.36% |
0.31% |
0.27% |
0.35% |
||
|
Any other ethnic group |
0.45% |
1.88% |
0.32% |
0.84% |
0.50% |
0.96% |
||
|
Not stated |
4.04% |
6.71% |
5.94% |
6.78% |
8.73% |
9.10% |
||
|
Not Known |
0.34% |
0.94% |
1.13% |
2.23% |
1.81% |
3.97% |
||
|
Deprivation Deciles
|
||||||||
|
Decile 1 |
0.52% |
1.06% |
0.61% |
0.62% |
0.89% |
0.89% |
||
|
Decile 2 |
1.09% |
1.49% |
1.03% |
0.92% |
1.65% |
1.57% |
||
|
Decile 3 |
4.18% |
3.87% |
3.28% |
3.25% |
4.09% |
3.89% |
||
|
Decile 4 |
4.28% |
3.73% |
3.64% |
3.45% |
4.30% |
4.16% |
||
|
Decile 5 |
9.14% |
8.24% |
8.62% |
8.28% |
8.63% |
8.16% |
||
|
Decile 6 |
12.37% |
12.11% |
11.33% |
11.33% |
11.47% |
11.91% |
||
|
Decile 7 |
15.05% |
14.68% |
15.63% |
16.60% |
14.93% |
15.51% |
||
|
Decile 8 |
20.34% |
19.24% |
21.04% |
20.63% |
19.95% |
19.68% |
||
|
Decile 9 |
17.81% |
18.56% |
18.16% |
18.57% |
17.71% |
18.20% |
||
|
Decile 10 |
15.23% |
17.02% |
16.68% |
16.35% |
16.37% |
16.03% |
||
*IMD Deciles: Decile 1 – most deprived, 10 – least deprived
Two additional examples of data collection (2024/25), with a health inequalities focus, are
- Smoking cessation services offered within SWFT:
- Adult inpatient settings (100% offered)
- Maternity inpatient settings (100% offered)
- Oral health - tooth extractions due to decay - among children admitted as inpatients ages 10 and under (due to low numbers it is deemed appropriate to suppress this data).
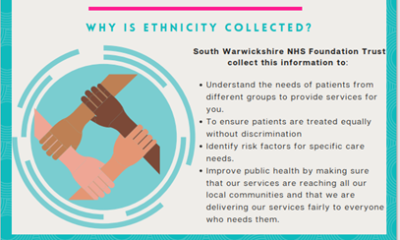
Improving ethnicity coding
One of the focus areas for SWFT has been around improving the completeness of ethnicity coding within the organisation.
SWFT are above the national performance in the admitted patient care records and the out-patient records (Table 2).
SWFT are continuing to contact patients, registered on the SWFT Patient Portal, with no ethnicity recorded so that records can be updated.
Table 2. Ethnic category recording, SWFT & National (2025)
|
Ethnic Category |
SWFT |
National |
|
Emergency Care Activity |
98.2% |
90.8% |
|
Admitted Patient Activity |
98.3% |
95.3% |
| Outpatient Activity | 94.5% | 91.2% |
|
Maternity Activity |
97.3% |
98.0% |
Population Health Management tools
Partners across Coventry & Warwickshire are working on the implementation and roll out of a Population Health Management tool, which will provide a source of linked data across all organisations to identify and target health inequalities across our population in order to take informed action.
Services in SWFT can respond to this and reduce health inequalities by ensuring fair access, experience and outcomes across different groups in the population.
Urgent and Emergency Care
People present to urgent and emergency care due to range of needs and reasons. However, increased attendance at urgent and emergency care is strongly linked with health inequalities, with some groups more likely to access urgent and emergency care than others.
At SWFT, we are working to understand who in our local population is experiencing health inequalities associated with urgent and emergency care attendance and what we can do to reduce these inequalities.
Did Not Attend (DNAs)
SWFT is continuing to explore the Did Not Attend (DNA) rates for each of our different specialties. The Trust’s overall DNA rate is within the lowest quartile nationally. However, as is the trend nationally, SWFT patients from the most deprived areas are more likely to not attend their appointments than those from the most affluent areas (Figure 3).
Figure 3: SWFT DNA rate by IMD Deciles (2025/26)
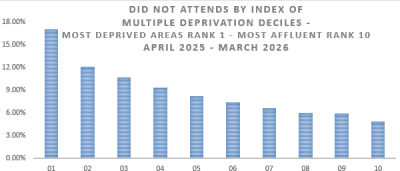
IMD Decile 1 - most deprived, Decile 10 - least deprived
The Trust will soon be undertaking a project to identify the potential underlying causes behind the increased DNA rates seen in the more deprived areas. Moreover, The Trust is also engaging with the Coventry & Warwickshire ICB around implementing a tool used to review inequalities that may be present in the provision of health and care services, to ensure they are accessible to all.
Waiting lists
The Trust has incorporated the relevant data into its waiting time patient tracking lists, to ensure our elective care provision is not further exacerbating health inequalities. In addition, further data analysis has been performed to explore our waiting lists by deprivation. This will provide more understanding of the existing health inequalities within our waiting lists.
Health Inequalities Champions Network
SWFT staff from across the whole organisation, have come together as Health Inequalities Champions to support the various health inequalities work taking place. This network is a voluntary subgroup of SWFT staff who are passionate about reducing health inequalities for their patients, both within their own role and through supporting their colleagues in other departments.
HEAT Assessments
The Health Inequalities Assessment Tool (HEAT) is a practical framework that enables NHS staff to systematically embed action on health inequalities and equalities in their work programme or service.
The HEAT tool supports services to identify actions that can be taken to tackle health inequalities, including any gaps in data or recording. This is important to increase our understanding and take action on broad range of factors that influence health inequalities.
Prevention
Prevention is a crucial part of the NHS's approach to reducing health inequalities and improving overall population health and. SWFT is working hard to create a culture of prevention and to embed in every service. A shift towards a culture of prevention will not only improve the health of our population, but it will also help to meet the predicted increase in demand going forward.